 eBird is a real-time, online checklist program that allows participants to submit their observations (including media) or view results via interactive queries of a database. The current version supports the Clements 2016 taxonomic list. This Internet application maintains personal bird observation records and enables users to visualize data with interactive maps, graphs, and bar charts. The underlying database of bird observations provides scientists, researchers and amateur naturalists with real-time data about bird distribution and abundance. eBird’s goal is to maximize the utility and accessibility of the vast numbers of bird observations made each year by recreational and professional bird watchers. The observations of each participant join those of others in an international network. The data are then available via Internet queries in a variety of formats.
eBird is a crowd-sourcing platform for all levels of birders and it smartly taps into the competitive nature of birders to grow its data holdings.
eBird is free, but you can also become an eBird partner for as little as $8 per month. As an eBird partner you will get access to new eBird functionality before it becomes publicly available, Cornell Lab membership (includes Living Bird) and a Cornell Lab calendar.
eBird is a web-based/cloud application and does not require installation. Mobile versions are available for iOS and Android and can be installed from iTunes and Google Play.
Taxonomic Support
eBird’s taxonomy is based on the Clements 2016 list. The eBird taxonomy is a hierarchical approach of multiple authoritative sources to creating species list for data entry across the world. You can download an excel version of the eBird taxonomy at the bottom of the page. eBird details their approach to developing these species lists well as part of their eBird Taxonomy help.
| Nov 19, 2016 | eBird |
| Birds | Clements 2016 |
| Butterflies | No |
| Herps | No |
| Mammals | No |
| Plants | No |
| Other | eBird only focuses on birds |
| Fix lists | No |
| Notes | Includes additions such as: Spuh Slash Identifiable Sub-specific Group Hybrid Intergrade Domestic |
Data Exchange With Other Programs
eBird provides options to export and import your data. Data export comes in two forms. Teh first one is the “Download my Data” and the second one is download an “Individual checklist”. Each downland has its own format. eBird’s “Download my Data” downloads all your records stored in eBird, which comes in handy if you want to upload all that information in different listing package. Individual checklists can be downloaded once you have submitted a checklist to eBird.
eBird’s import tool is designed to provide an interface through which records from other data sources (spreadsheet, text files, exports from other programs) can be imported to eBird. The import tool has specific requirements in terms of the file type and format. eBird’s help system describes importing data as a tricky process with patience and attention to detail required. However, with many packages providing a ready-to-import eBird file, this is no longer the case. eBird allows users to format their data in two ways: eBird Checklist Format and eBird Record Format. Details can be found in eBird’s Help section on importing.
Data Entry
As part of the data entry process eBird’s users will first need to specify the location and birding protocol. Using a map or a checklist for a geographic region, users can select a location from eBird’s database. If your location does not yet exist, you can create one on the fly.
eBird uses location specific checklists to enter data. Location specific checklist are based on observations that other users have submitted before. Therefore, the users will only see a small fraction of all species on a taxonomic list. Each checklist consists of 3 sections; 1) species seen more then 10% of the time; 2) species seen less then 10% of the time; and 3) species not yet seen at this location. Using this approach reduces time navigating (aka scrolling up and down) the checklist and total number of birds seen can be entered. In addition users can add photos, sound recordings, breeding code, aged and sex, and notes. Overall data entry is very easy and very fast.
eBird provides two different file formats that users can use to upload data into eBird. These file formats are checklist and record. The process of uploading data is very easy. If species or locations are mismatched or unknown, users have the option to correct this information before the data is committed to the database. Detailed information on how to upload data is provided on the eBird Upload Data page.
Mobile Version
eBird Mobile is available for free, but you must have an eBird account to use it. Data entry is easy, because the program automatically downloads tailored checklists for your location or hotspot. This results in a short checklist with “Likely” birds you may see. Other options include “All” or “Checked”. Using shorter lists makes it very easy to add an observation and count. However, a main drawback with recent taxonomic lists updates, is the addition of spush’s and subspecies such as “Downy Woodpecker (Eastern)” or “Woodpecker sp”. This results in a very long lists that become cumbersome to scroll through. You can use the smart search feature or banding codes to quickly jump to a species. When you are in the field and record additional sightings for the same species simply tapping the count field will increase the total birds seen. Also, seeing which species you already have recorded is a plus in this application.
eBird’s Mobile application works well in off-line mode. It is possible to download checklists of the locations you will be visiting before you go in the field. This facilities data entry with shorter checklists and you immediately see if you are recording any rare or noticeable species.
Reporting
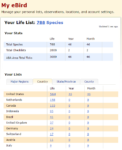
eBird provides its users with a large variety of reports and tools to explore the available information. Foremost are the life lists. These are presented as summary tables at various geographic scales. For each geographic entity the total life, annual and monthly species counts are provided. Each summary table allows the user to drill down to the actual species lists and individual observations as needed.
With a few clicks of the mouse, users can quickly generate basic summary tables for weekly, monthly and yearly time periods. The resulting summary table includes high count, abundance, frequency and group size.
A frequently used reporting in eBird is the species abundance bar chart. For any given region or location and time period, users can generate abundance charts depicting the likely occurrence of species on a weekly basis. This is a rather useful chart when you plan to visit specific location or birding hotspots. Also, the chart depicts how common a particular species at that location. Hotspots and regions can further be explored in specialized web tools that enable users to see who birded there, what was seen and when. All the tools are handy for trip planning purposes.
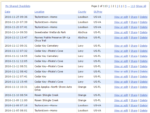
A basic functionality in eBird is the ease with which you can access your submitted checklists. Checklists can be edited and shared with other birders in your party. Likewise, other birders can share their lists with you.
The power of this citizen science program is most visible in the species distribution maps. Based on the submitted data, you can view generalized distribution maps (at a 500 km resolution) for the world. As you zoom in this map provides more detailed information of the exact location where the species has been observed. Refinements by time period can be made by the user so you can determine it a species has been observed in November in your area.
The image gallery below shows eight examples that illustrates eBird output and reports that users can access.
- eBird Life Lists
- eBird Summary of observations
- eBird summary of observations showing group size
- eBird species bar chart for Virginia
- eBird Frequency chart
- Snapshot of my checklists in eBird
- Snapshot of eBird My Shared Checklists
- Example of an eBird species (Northern Shrike) distribution map
The table below provides an overview of the various reports, charts and maps that eBird offers their users.
| Report | eBird |
| Life List | |
| World | Life/Year/Month |
| Continent | Life/Year/Month |
| Country | Life/Year/Month |
| State | Life/Year/Month |
| County | Life/Year/Month |
| Location | Life/Year/Month |
| ABA Region | Life/Year/Month |
| ABA Ticks | Life/Year/Month |
| Yard Totals | “competitive” yard birding |
| Charts | Multiple species abundance |
| Single species frequency/group size/average/abundance/high count/totals | |
| Maps | |
| Species | |
| Hotspots | |
| Other | |
| All-time First/Last | Region/County/Hotspot/IBA |
| Checklist (observations for a single date/time/location) | Location |
| Checklists (printable) | Location/Hotspot |
Noteworthy Features
As eBird continues to grow, more functionality is being offered to the user. Increasingly it is more difficult to keep track of all the offered features. Three features are worth mentioning and they include:
The hotspot exploration page(s) that highlight recent sightings, checklists, birding activity and top birders for a county, state, province, or country. If you are planning to visit an area, use of this tool will quickly provide insights in bird activity and you can target specific location for species.
Alerts and targets allow the users to get daily updates on unusual and rare sightings for a county or receive alerts on specific species of interest. These tools are geared to those chasing these species or seek new lifers.
eBird User Profile is a feature that provides an interactive map, access to your submitted photographs and sound records as well as lifer counts for the regions displayed on the map.
Last updated: January 18, 2017
Copyright (c) 2017 The Test Garden


